Instructions
Download this document and answer the questions in it. Then, upload your answers to Box.
Remember to anonymize your submission. Your file name should contain only your Participant ID Number and the section number. For example, if your Participant ID Number is 103, your file name should be “SFD32_P103.docx.” Note that “SFD” stands for “Solar Farm Design.” Section 3.2 is abbreviated as 32. “P” stands for “Participant.”
Click here to return to Section 3.2 in the textbook.
Click here for Aladdin Reference Slides.
Practice Example: Solar Farm Design
Organize Your Designs with Projects
You can create, view, and compare multiple designs within a single project:
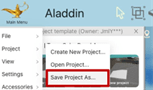
- Open this Aladdin GD project template. Select Main menu> Project> Save project as
- Double click on a design in a project to open the design
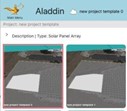
- Your design is open when you see a cloud put on the project panel
- This is how your screen should look when you open a project panel
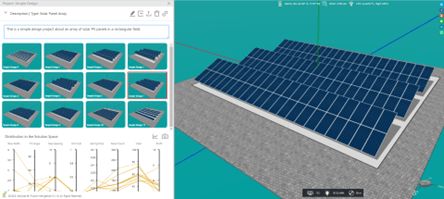
Think back to the PD activity, where you entered the 3 design variables (tilt angle, row width, inter-row spacing), and the layout wizard generated one solar farm design based on those variables. Now in GD, you can simply set an objective and enter the search ranges for each design variable, and the GD algorithm will iterate through dozens of designs within those search ranges.
Steps:
A. Open your own copy of the GD project and double click on the first design.
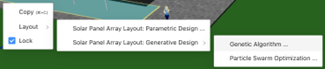
B. Right click on the gray area below the solar panles and select “Layout > Solar Panel Array Layout: Generative Design > Genetic Algorithm”.
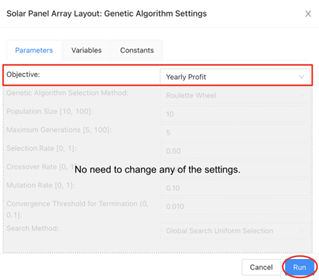
C. On the “Parameters” tab, select the desired objective. Keep everything else at their default values.
D. Select “Run”. (Use the default settings – no need to change anything.). Watch as AI tries different new designs.
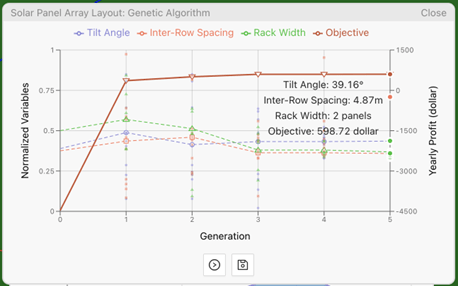
E. When AI completes its work, Aladdin will report the result in a graph. Hover over the last generation to see the best design that AI has generated in this run.
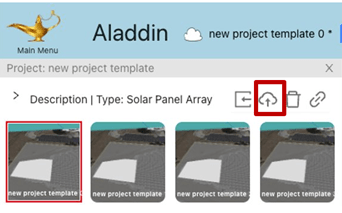
Update the selected design ![]() to save your first GD design, which will also overwrite the first design template.
to save your first GD design, which will also overwrite the first design template.
- Generate three different designs for each of the following objectives:
- Yearly profit
- Yearly mean yield
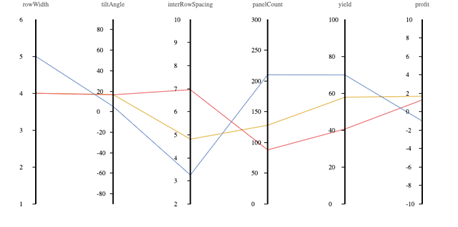
- Replace the placeholder image below with a parallel coordinate plot of your six GD designs. Note: you can change the scatter plot and parallel coordinate plot axes ranges by double clicking on the variable name in the parallel coordinate plot and changing the minimum and maximum values.