Instructions
Download this document and answer the questions in it. Then, upload your answers to Box.
Remember to anonymize your submission. Your file name should contain only your Participant ID Number and the section number. For example, if your Participant ID Number is 103, your file name should be “SFD23_P103.docx.” Note that “SFD” stands for “Solar Farm Design.” Section 2.3 is abbreviated as 23. “P” stands for “Participant.”
Click here to return to Section 2.3 in the textbook.
Click here for Aladdin Reference Slides.
Practice Example: Solar Farm Design
5. Your PD designs have been saved to your project, but do they actually perform as well as
you expect? Follow the instructions below to evaluate your designs.
Organize your Designs with Projects
● Double click the first design in your project to open it.
● Analyze the yearly energy output (“Main Menu > Analysis > Solar Panels > Analyze
Yearly Yield”).
● Update the design in the project. Make sure the design is both open and selected.
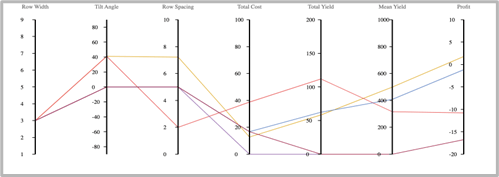
You should now see the updated objectives (such as total yield, profit, and mean yield)
in the parallel coordinate plot below.
● Repeat these steps for all designs in your project.
a. Replace the placeholder plot below with the actual scatter plot.
b. Generate a scatter plot with “Profit” as the X-axis and “Mean Yield” as the Y-axis, and replace the placeholder plot below with the actual scatter plot. [Note: you can change the scatter plot and parallel coordinate plot axes ranges by double clicking on the variable name in the parallel coordinate plot and changing the minimum and maximum values.]

6. Which design has the most yearly profit (and is therefore non-dominated)?
7. Which design has the most yearly average output (and is therefore also non-dominated)?
8. Is the remaining design non-dominated (i.e., better in at least one objective than any other design)? Or is it dominated by any design?
